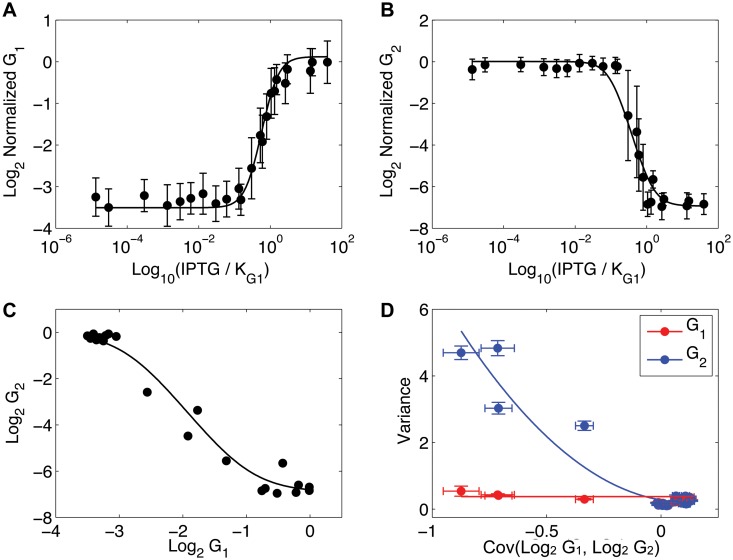
Fig 3. E. coli synthetic transcriptional network.
(A) IPTG dose-response of G1. (B) IPTG dose-response of G2. (A-B) Averages of the log of the normalized G1 (A) and G2 (B) concentrations ±1 s.d. (C) Transfer function of G1 versus G2 (log scale). The negative slope is indicative of the repression of G2 by G1. (D) INDUCE analysis showing the fit of a two-node network model (solid curves). Error bars are 1 s.d. in computed in 1000 bootstraps of the data.

