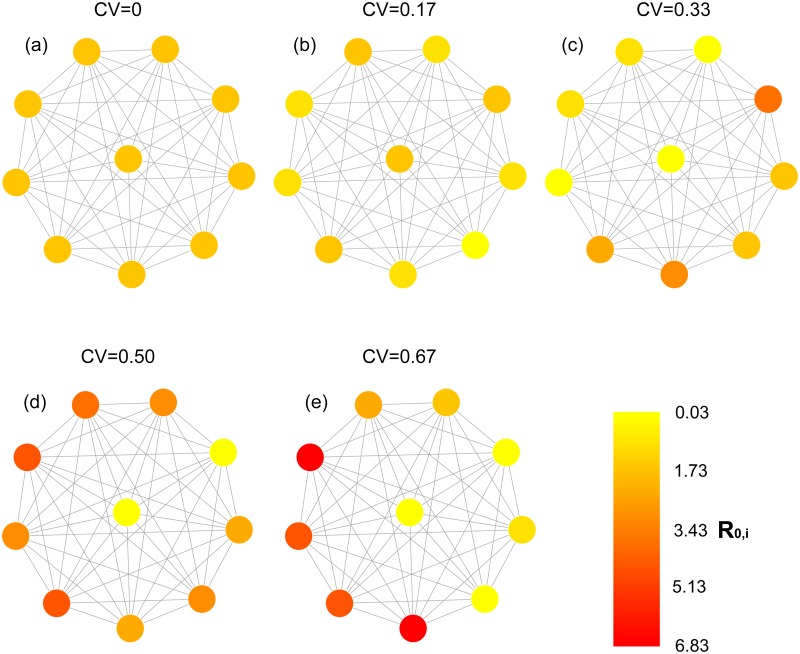
Fig 1. Network representation of simulated landscape configurations.
Nodes represent patches characterized by their randomly generated R 0,i, and links represent host movement. Each configuration represents a particular scenario of spatial heterogeneity in transmission intensity, which increases with increasing coefficient of variation (CV).

