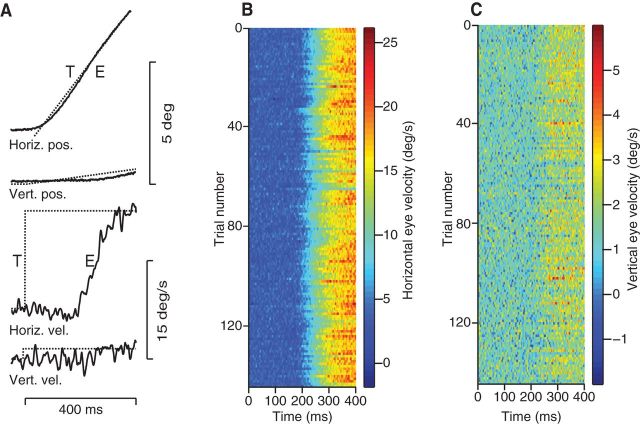
Figure 3.
Pursuit response to a step in target motion. A, Pursuit response to a spot target moving at 15°/s in a direction of 6°. Shown are the horizontal and vertical components of eye (E) position and velocity in response to target (T) motion. Top to bottom, Superimposed horizontal target and eye position (Horiz. pos.), superimposed vertical target and eye position (Vert. pos.), horizontal target and eye velocity (Horiz. vel.), and vertical target and eye velocity (Vert. vel.). The x-axis represents time with respect to target motion onset. B, C, Density plots in which colors indicate horizontal and vertical eye velocities and each line represents a response to the same target motion. Time is relative to target motion onset.

