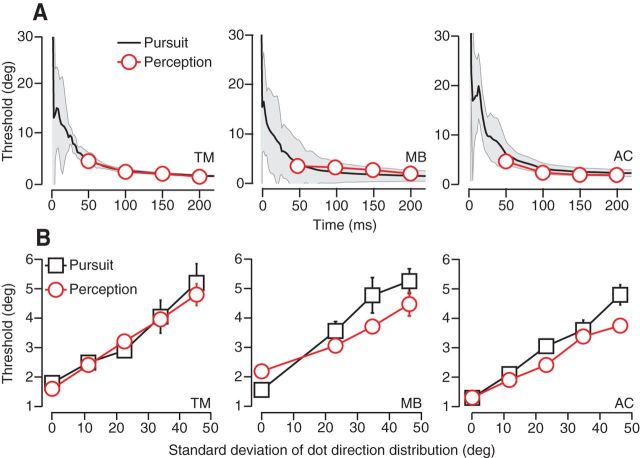
Figure 4.
Direction discrimination in pursuit and perception in three subjects. A, Threshold time course for discrimination of small differences in direction of a target moving at 10°/s. Pursuit threshold values (black), calculated from eye velocity, represent the angular difference in target direction that yields 69% correct discrimination. Time is defined with respect to pursuit onset. The gray regions indicate SDs. Perceptual thresholds (red symbols) are calculated via probit analysis and are plotted as a function of viewing duration. Error bars indicate SD. B, Direction discrimination thresholds for pursuit and perception are plotted as a function of the SD of dot directions within fixed-seed noisy-dots targets. Thresholds correspond to a viewing duration of 240 ms or the first 240 ms of pursuit.

