Figure 8.

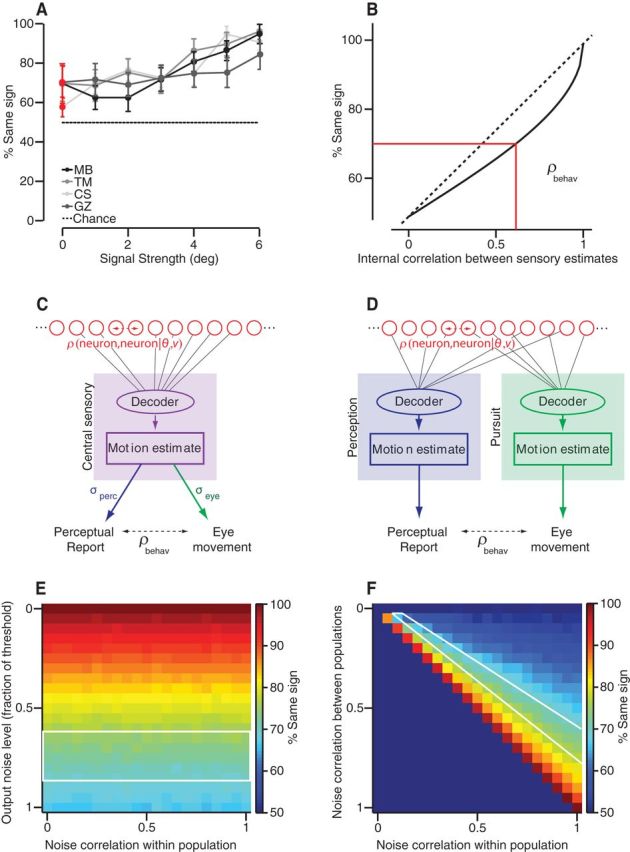
Correlation of direction estimates between pursuit and perception, data and model. A, Percentage of trials for which perceptual reports had the same rotational sign as the pursuit eye movement plotted as a function of the absolute direction difference between stimuli. B, Relationship between percentage sign agreement and the underlying correlation between perceptual report and eye movement. C, D, Conceptual models representing two decoding schemes for neural population activity to derive target direction estimates for perception and pursuit. Red circles represent inputs from a homogeneous sensory population with equal variance direction estimates and a uniform level of noise correlation. Decoders average direction estimates. C, A single decoder (purple box) forms a direction estimate that is shared between perceptual and pursuit processing streams. Each stream adds noise independently to its output (σE, σP). D, Two identical decoders (blue perception, green pursuit) estimate target direction from two closely related populations (identical variance and within-population noise correlations as in C); between-population correlations vary. No additional noise was seen. E, Percentage sign agreement expected from the model in C. Data are plotted as a function of the noise correlation within the neural population and the output noise level as a fraction of the decoder threshold. F, Percentage sign agreement in behavioral outputs from model in D. Data are plotted with respect to within- and between-population levels of noise correlation.
