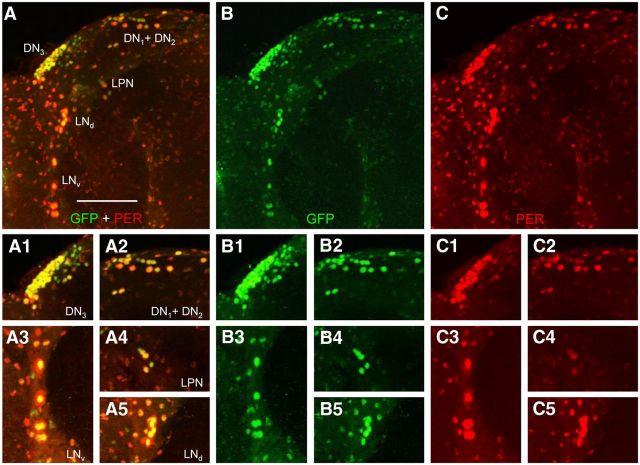
Figure 2.
Spatial expression of CLK-GFP in brains from adults. Brains were dissected from Clk-GFP; Clkout adults collected at ZT22, immunostained with GFP and PER antisera, and imaged by confocal microscopy. A–C, A 102 μm projected Z-series image of the left brain hemisphere from an adult fly, where lateral is left and dorsal is top. GFP + PER (A), GFP (B), and PER (C) immunostaining is detected in DN1s, DN2s, DN3s, LNds, LPNs, and LNvs. Colocalization of GFP (green) and PER (red) is shown as yellow. A1–C5, Magnified view of pacemaker neuron subgroups from A (A1–A5), B (B1–B5), and C (C1–C5). A1, B1, C1, Images of a 46 μm projected Z-series of DN3s. A2, B2, C2, Images of a 38 μm projected Z-series of DN1s + DN2s. A3, B3, C3, Images of a 14 μm projected Z-series of LNvs. A4, B4, C4, Images of a 12 μm projected Z-series of LPNs. A5, B5, C5, Images of a 20 μm projected Z-series of LNds. Scale bar, 50 μm. All images are representative of 12 or more brain hemispheres.

