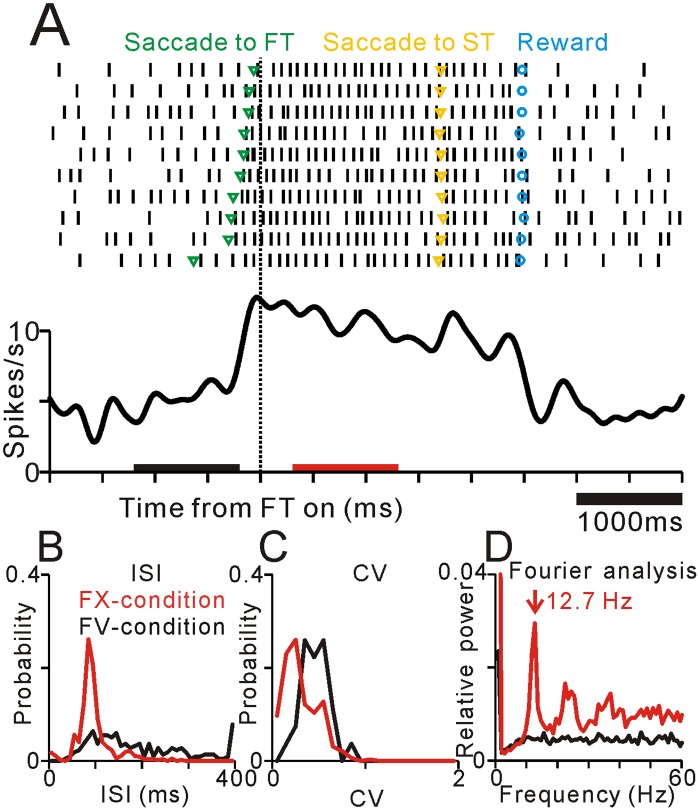
Fig 3. Example of the activity of a typical neuron in the PPTN that exhibited periodic firing during the FX-condition.
(A) Rastergrams (top) and spike density functions (bottom). Data are aligned to the appearance of the FT and sorted by relative timing of the centering saccade. This example neuron exhibited periodic firing pattern during the FX-condition. Green, yellow, and blue markers indicate the timing of centering saccades, saccades to target stimulus, and reward delivery, respectively. Black and red bars indicate the FV- and FX-conditions, respectively. (B-D) Plots of ISI (B), CV (C), and power spectrum (D) during the FX- (red) and FV-conditions (black).

