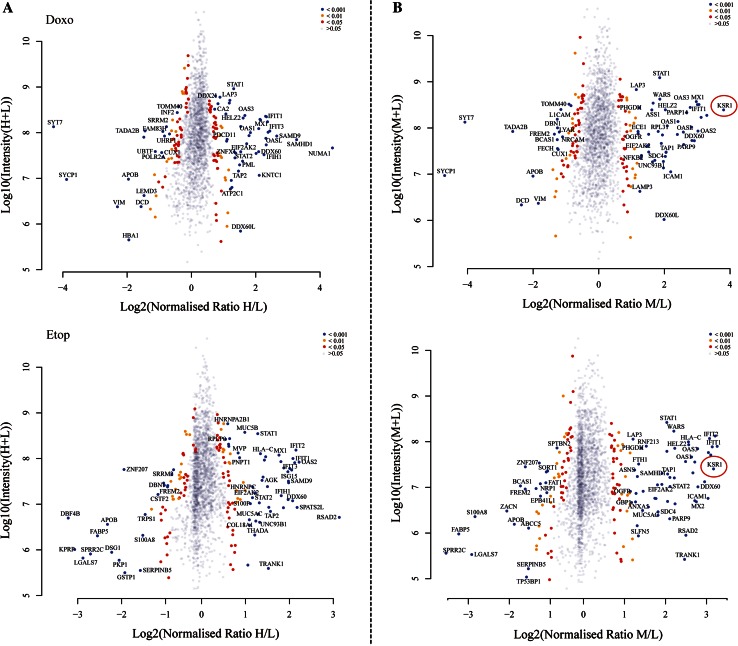
Fig. 3.
Distribution of protein ratios from identified proteome in two datasets. Volcano plots showing the Log2 ‘normalized ratios’ (M/L) against Log10 ‘intensity’ (M/L) for each characterised protein in response to doxorubicin or etoposide stimulus (a), and affected by KSR1 in the presence of doxorubicin or etoposide (b). Proteins are displayed based on P values from Significant B test. Blue circles are proteins with a P value of <0.001; yellow are proteins with a P value between 0.001 and 0.01; red represent P values between 0.01 and 0.05; grey are proteins whose fold change is not significant (P > 0.05). KSR1 is highlighted showing a pronounced increase in its protein abundance, supporting a good reproducibility and accuracy of the technique (b)

