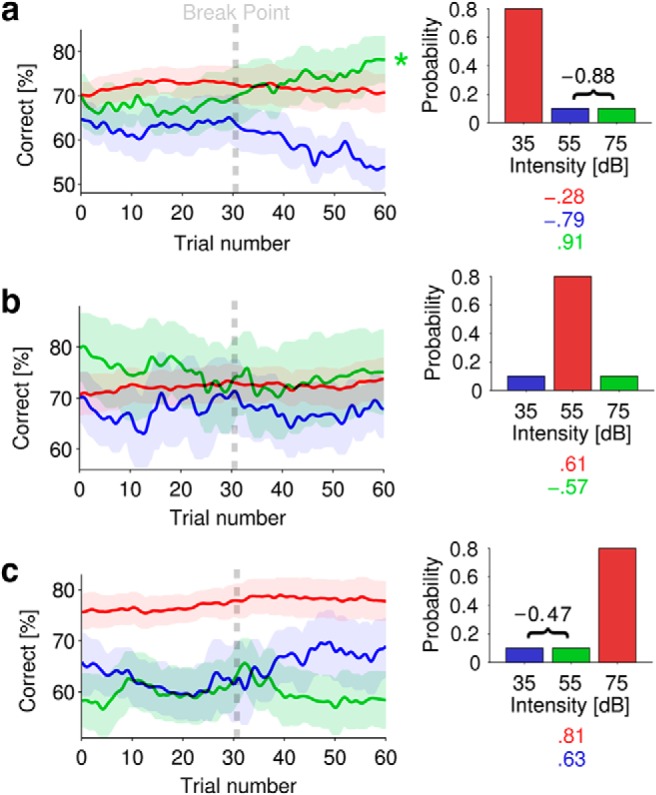
Figure 2.

Intensity discrimination accuracy changed over time for different intensity statistics. a–c, Mean (±SEM) accuracy for each stimulus (35, 55, or 75 dB) in different epochs. The color-coded correlations (r values shown below each respective diagram distribution) capture significant overall trends with time. For each epoch, correlations were also computed between the two respective low-probability (10%) functions and r values are noted (in black) with bracket. Correlation values are only given where significant (p < 0.01). a, Performance in epochs where 35 dB trials occur with 80% probability. b, Performance in epochs where 55 dB trials occur with 80% probability. c, Performance in epochs where 75 dB trials occur with 80% probability. Asterisks denote significant fluctuations in performance (p < 0.01, Friedman rank sum test). Each trial corresponds to ∼2 s (mean trial time across both experiments, 2 s; SD, ±0.3).
