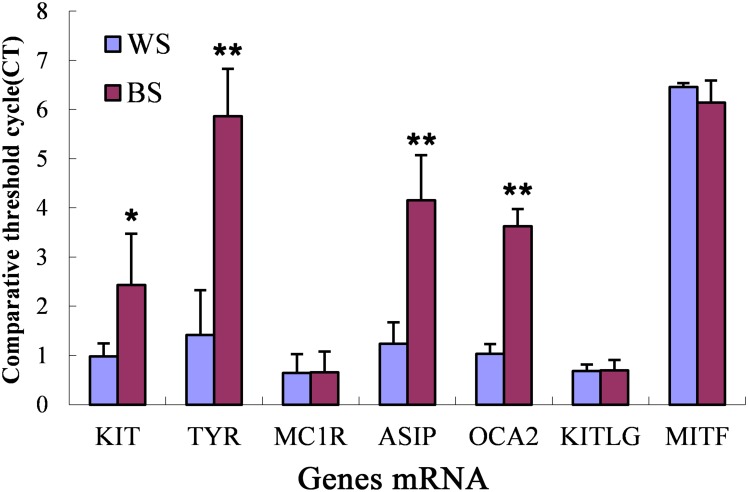
Fig 4. Quantification of the mRNA levels from the RNA extracted from the skin of black (black chicken, red bars) or white chickens (white bars).
The bars represent the adjusted ct values; therefore, higher values represent higher mRNA levels. The error bars are the S.E. for 6–8 samples from each skin color group. * 0.01<p<0.05 ** p<0.01.

