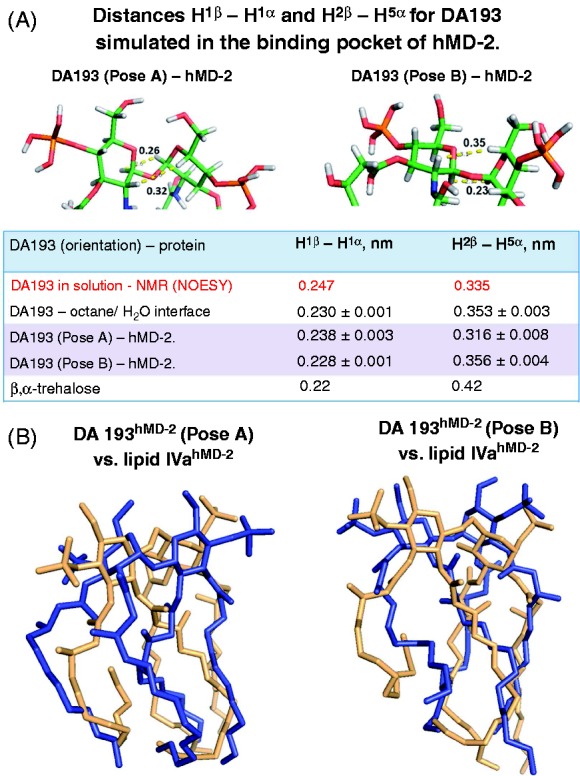
Figure 8.

(A) Conformation of the βGlcN(1↔1)αGlcN backbone of DA193 simulated in the binding pocket of hMD-2 and at an octane–water interface compared with the conformation experimentally obtained from the NOESY NMR experiments of the ligands in solutions. Images were generated with PyMol. Averages of MD simulations were calculated as <r-3>–1/3 and error estimates were obtained from block averaging. NMR distances are considered as upper bounds such that the length longer than the experimental value is a violation, while any value that is lower than the experimental value is allowed. (B) Superimposition of antagonistic lipid IVahMD-2 (light orange, PDB code: 2E59) with (A) simulated DA193hMD-2 (blue) in pose A and (B) with simulated DA193hMD-2 in pose B; hMD-2 is not shown for clarity.
