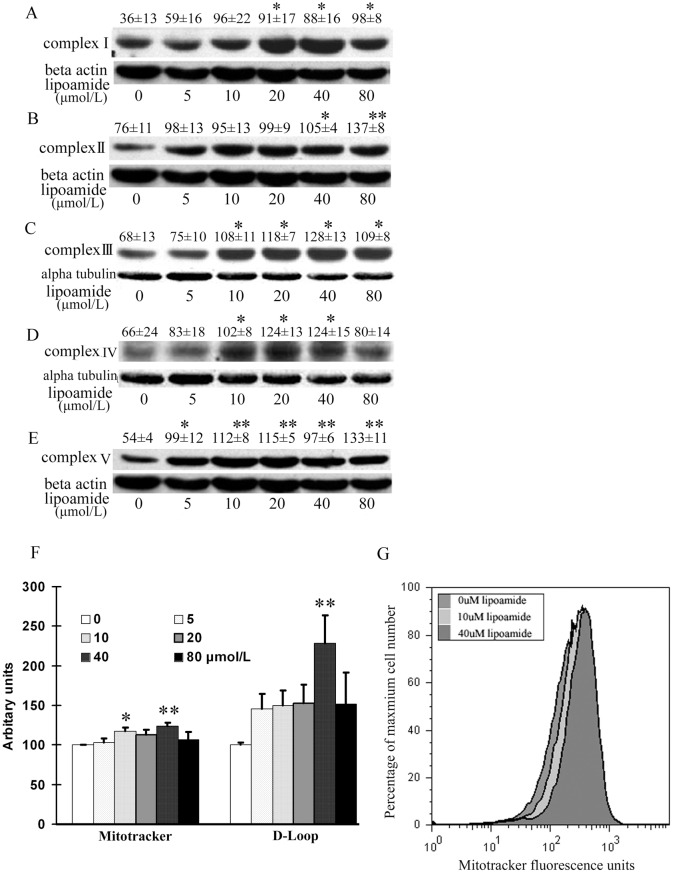
Fig 1. LM increased ETC complex I, II, III, IV and V protein expression (A-E), mitochondrial DNA copy number (F) and viable mitochondria (G).
ARPE-19 cells were treated with the indicated concentrations of LM for 48 h, and then subunits expression of the complexes were detected by western blot. The subunits tested were 39 KD, 70 KD, 51.6 KD, 57 KD and 56.6 KD for complexes I to V (A to E), respectively. The images are representative; the quantitative results are from optical density analysis of images of three independent experiments. For complexes I, II and V, the loading control was β-actin; for complexes III and IV, it was α-tubulin instead. Results are the ratios of the complex densities to those of β-actin or α-tubulin. Values are means ± SEM. Differences were evaluated statistically with student’s t test. * p<0.05, and **p<0.01 vs. untreated control (0 μmol/L). (F) LM increased viable mitochondria and mitochondrial DNA copy numbers. ARPE-19 cells were treated with the indicated concentrations of LM for 48 h. For viable mitochondria measurement, cells were stained with Mitotracker Green. Fluorescence values read by flow cytometry were considered as estimates of viable mitochondria. Results are in arbitrary units normalized by setting the fluorescence of untreated (0 μmol/L LM) cells to 100. Values are means ± SEM from three independent experiments, each performed on three samples at each concentration. For mitochondrial DNA copy number measurement, real-time PCR was employed for assaying the D-LOOP region of mitochondrial DNA. The results shown are ratios of D-LOOP to 18S rDNA. Results are in arbitrary units normalized by setting the ratio of untreated (0 μmol/L LM) cells to 100. Values are means ± SEM from four independent experiments. Statistical significance of differences was established by student’s t test. * p<0.05, vs. 0 μmol/L treatment and **p<0.01 vs. untreated control (0 μmol/L) (G) A representative flow cytometry histogram was created with Flow Jo, Ver. 4.87 software. The fluorescence curves of 0, 10 and 40 μmol/L LM treatments were right-shifted with respect to the 0 μmol/L curve.

