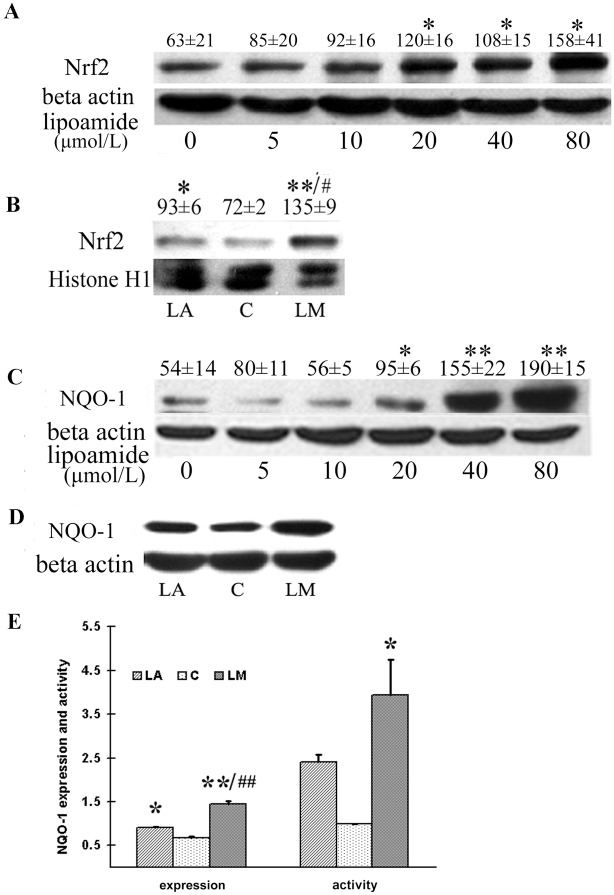
Fig 4. LM treatment increased Nrf2 expression in both total and nuclear protein fraction, and increased expression and activity of NQO-1.
ARPE-19 cells were treated with the indicated concentrations of LM for 48 h, or 40 μmol/L of LA or LM if concentrations not indicated. (A) A representative image of Nrf2 expression in total protein detected by western blot. Optical densities were analyzed with Quantity One software, and results are expressed as ratios of Nrf2 to β-actin in arbitrary units. (B) A representative image of Nrf2 expression in nuclear protein. Quantitative analysis of Nrf2 expression in nuclear protein was quantified in the same way as for Nrf2 expression in total protein. (C) A representative image of NQO-1 expression detected by western blot. Quantitative analysis of NQO-1 expression in total protein was performed in the same wa with Nrf2.. (D) A representative image of NQO-1 expression. (E) Quantitative analysis of NQO-1 expression and activity. All values are means ± SEM of four independent experiments. Statistical significance was established by one way ANOVA followed by the Tukey test. *p<0.05, and **p<0.01 vs. control, and #p<0.05, ##p<0.01 vs. LA treatment.

