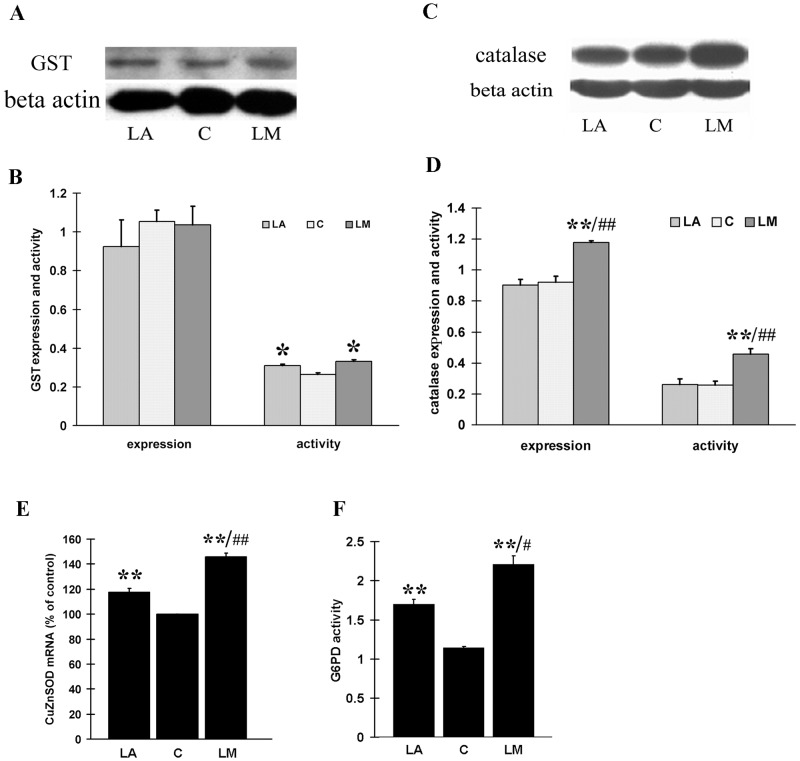
Fig 5. The effects of LM and LA on expression and activity of GST, catalase, Cu/ZnSOD and G6PD.
ARPE-19 cells were treated with 40 μmol/L LM or LA for 48 h. (A) A representative image of total GST expression detected by western blot. (B) Quantitative analysis of GST expression (4 independent experiments) and activity (5 independent experiments). (C) A representative image of catalase expression detected by western blot. (D) Quantitative analysis of catalase expression (4 independent experiments) and activity (3 independent experiments). The results are expressed in arbitrary units and each experiment was performed in duplicate. (E) Transcriptional expression of Cu/ZnSOD. Real time RT-PCR was employed to measure expression levels of Cu/ZnSOD. Results (from 5 independent experiments) are expressed as ratios of Cu/ZnSOD to 18SrRNA. (F) G6PD activity was measured as described in Methods. Values are means ± SEM of three independent experiments. All statistical significance were established by one way ANOVA followed by the Tukey test. * p<0.05, **p<0.01 vs. untreated controls (0 μmol/L), #p<0.05 vs. LA, and ##p<0.01 vs. LA.

