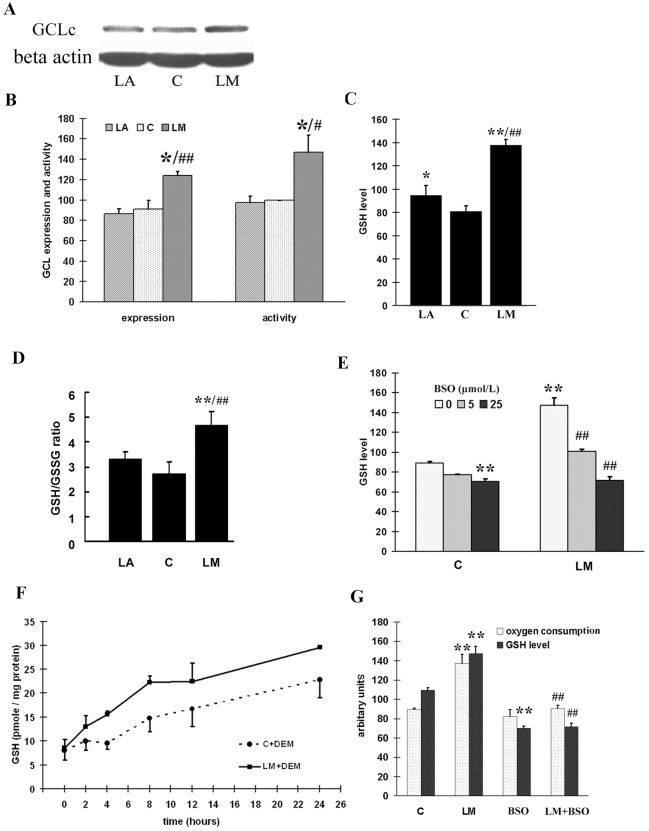
Fig 6. GSH levels was increased in LM treated ARPE-19 cells, and enhanced oxygen consumption was related to de novo GSH synthesis.
(A) A representative image of GCLc expression detected by western blot. (B) Quantitative analysis of GCLc expression (4 independent experiments) and GCL activity (3 independent experiments). (C) Quantitative analysis of GSH level. Averages of four independent experiments are displayed in arbitrary units. Values are means ± SEM. (D) Quantitative analysis of GSH/GSSG ratio Total glutathione and oxidative form glutathione (GSSG) was measured as described in method, GSH/GSSG ratio was caculated. Values are means ± SEM from three independent experiments. (E) LM increases GSH levels by GCL activation. ARPE-19 cells were treated with or without 40 μmol/L LM, and 5 or 25 μmol/L BSO was added to the media at the same time; after 48 h, GSH levels were measured spectrometrically as described in Materials and Methods. The results in arbitary units are averages of three independent experiments. Values are means ± SEM. (F) LM treatment improved recovery of cellular GSH levels with time. ARPE-19 cells were treated with or without 40 μmol/L LM for 48 h, and then exposed to media containing 2 mmol/L diethyl maleate (DEM) for 90 min to deplete cellular GSH; the recovery of GSH was examined over time. LM+DEM recovery was significantly higher than C+DEM. The results are shown as means ± SEM from four independent experiments. Statistical significance was established by two way ANOVA followed by the LSD test. (G) Effect of LM on BSO-induced decrease in oxygen consumption and GSH levels. ARPE-19 cells were treated with or without LM (40 μmol/L) or BSO (25 μmol/L) for 48 h, then the GSH level and oxygen consumption were examined as described in Materials and Methods. Values are means ± SEM of three independent experiments. For A, B, C, D, E and G, statistical significance was established by one way ANOVA followed by the Tukey test. In A, B, C and D* p<0.05, **p<0.01 vs. untreated controls (0 μmol/L), #p<0.05 vs. LA, and ##p<0.01 vs. LA. In E and G, **p<0.01 vs. untreated controls, and ##p<0.01 vs. LM treatment

