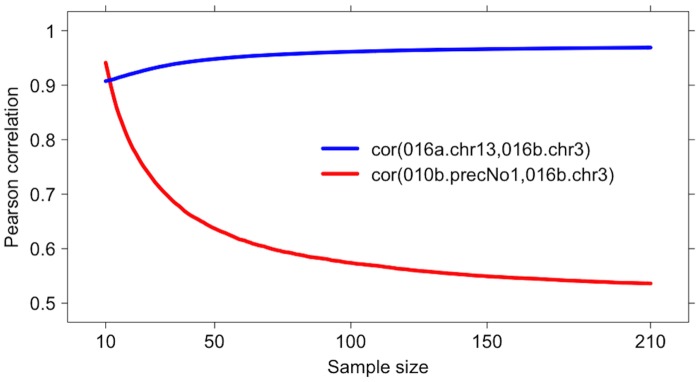
Fig 1. HCC dataset: PCC versus sample size for the coexpression of hsa.mir.016a.chr13 with hsa.mir.016b.chr3 (blue line) and with hsa.mir.010b.precNo1 (red line).

When the correlation is computed on the 10-sample set S the correlation between the two uncoexpressed probes is even higher than the correlation between the two probes sharing an almost identical alignment. When more samples are randomly added, the blue line slightly increases, while the red line quickly drops to the final value 0.536 on the whole dataset H. Both curves are averaged over 1000 randomisations of the added samples, keeping the sub-cohort S constant.
