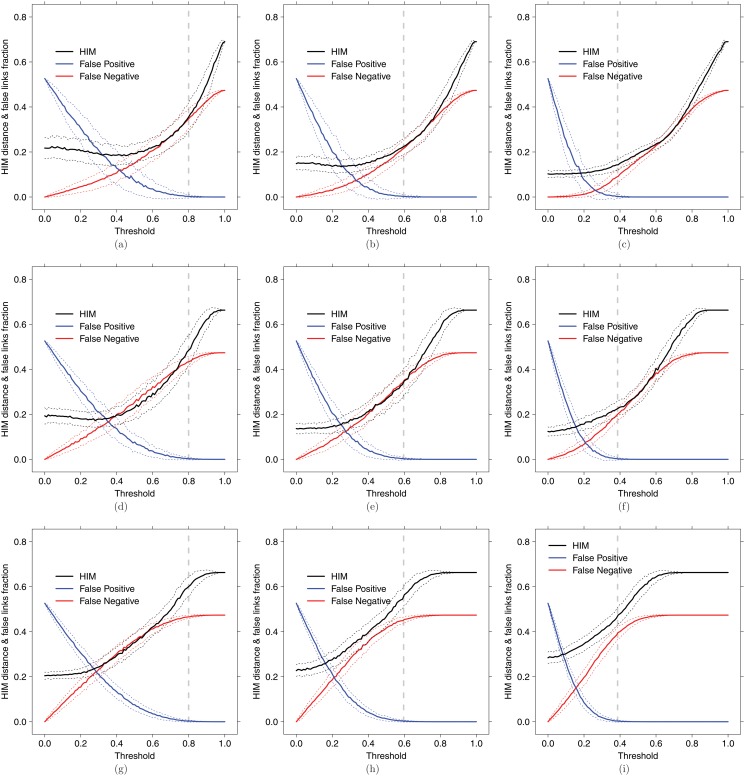
Fig 5. Synthetic dataset  .
.
Coexpression inference of the  network from random subsampling of the
  dataset, without noise (a,b,c), with 20% Gaussian noise (d,e,f) and with 40% Gaussian noise (g,h,i), on 10 (a,d,g), 20 (b,e,h) and 50 (c,f,i) samples. Solid lines indicate the mean over 500 replicated instances of HIM distance (black), ratio of False Positive (blue) and ratio of False Negative (red); dotted lines of the same color indicate confidence bars (+/-σ), while grey vertical dashed lines correspond to the secure threshold .

