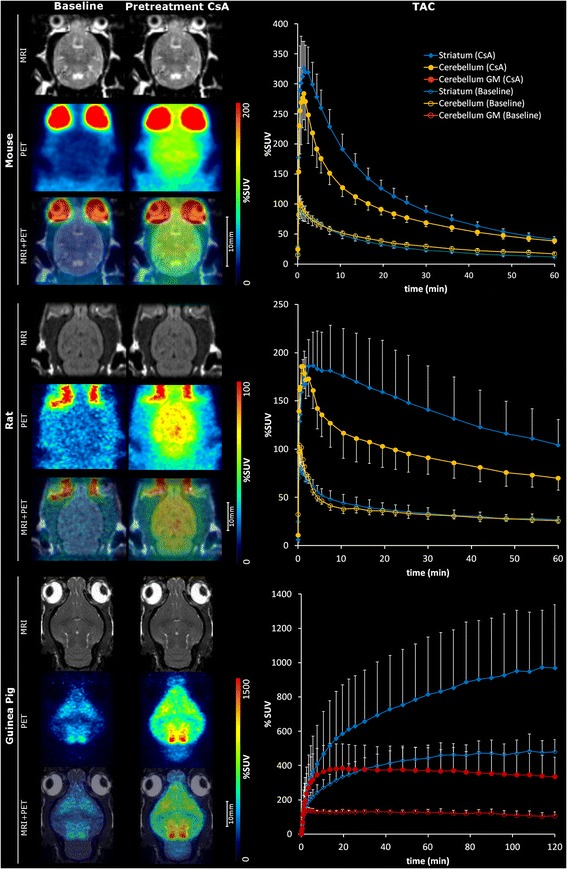
Figure 1.

PET images and TAC curves of [ 11 C]AZ10419369 uptake in mouse, rat, and guinea pig. Representative uptake images (left) and time activity curves of striatal and cerebellar uptake (right) of [11C]AZ10419369 in mouse (top), rat (middle), and guinea pig (bottom) in baseline and pretreatment conditions. The images are a summation from 10 min until the end of the scan (total 53 min in the case of rat and mice and 113 min in the case of guinea pig), while TAC curves are presented as mean values and SD as error bars in mice (n = 8), in rats (n = 7), and in guinea pigs (n = 7).
