
Figure 3.
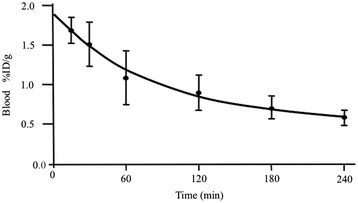
IG3 blood uptake at different times after i.v. injection. After IG3 injection, specific activity of blood samples was gamma counted. Values are given as %ID/g (mean ± SD) of duplicates measurements from twelve independent experiments. IG3 uptake decreased in a time-dependent manner (p for trend < 0.0001). % ID/g, percent injected dose per gram.