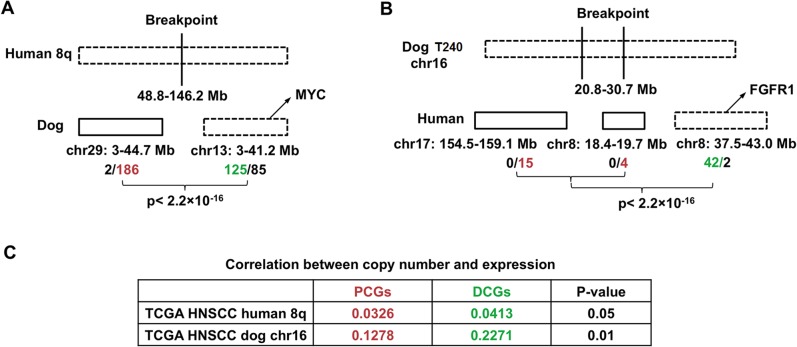
Fig 6. Pilot HNSCC driver–passenger discrimination via human–dog comparison.
(A) Driver-passenger discrimination of human 8q. Human 8q is broken into dog chromosomes 29 (chr29) and 13 (chr13), with the numbers indicating the sequence coordinates. In human HNSCCs, the entire human 8q and all genes encoded (398 total) are recurrently amplified, as represented by a broken lined bar. In canine tumors, however, only chr13 is significantly amplified resulting in 125 genes being amplified and 85 genes unchanged, compared to only 2 genes amplified and 186 genes unchanged for chr29. The 125 amplified genes on chr13, including MYC, are considered as driver candidate genes (DCGs; in green), whereas the 186 unchanged genes on chr29 are deemed passenger candidate genes (PCGs; in red). The p-value shown is obtained with Fisher’s exact test; see S1H Table. (B) The 10Mb amplicon on chromosome 16 in tumor 240 (Fig 2B) is broken into three distinct regions in the human genome as shown. Only one region is significantly amplified in human HNSCC according to TCGA [1], and the amplified genes encoded there, including known driver FGFR1 [1], are considered as driver candidate based on our dog-human comparison strategy [30]. The p-value shown is obtained with Fisher’s exact test, see S1H Table. (C) The correlation between copy number status, represented by a gene’s value, and mRNA expression level, represented by a gene’s log2(FPKM) from RNA-seq or log2(intensity) from SNP arrays. The data are from TCGA [1]. The p-values shown are obtained with Hotelling's t-squared tests, see S1H Table.

