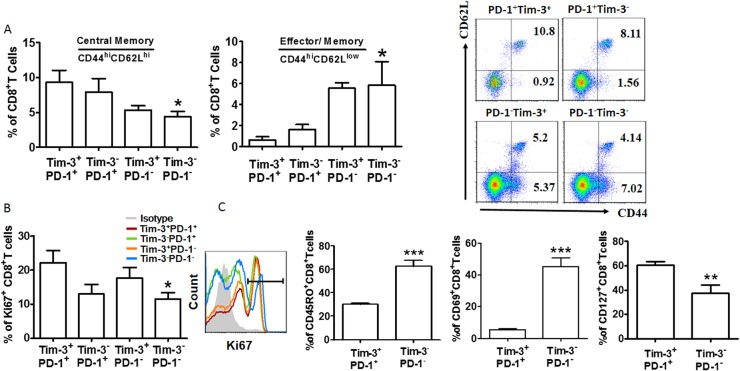
Fig 2. CD8+ T cells co-expressing Tim-3 and PD-1 display a TCM phenotype in AS.
(A) CD8+ T cells from donors (n = 12) were stained with antibodies against CD44 and CD62L to determine their differentiation phenotype (see Results). Percent of PD-1+ Tim-3+, PD-1+ Tim-3-, PD-1- Tim-3+, and PD-1- Tim-3- cells within each population. The flow cytometry plot is from one representative experiment. (B) Quantification of Ki67 staining in PD-1+ Tim-3+, PD-1+ Tim-3-, PD-1- Tim-3+, and PD-1- Tim-3- CD8+ T cells; n = 10. (C) CD8+ T cells from lesional arterial blood were stained with antibodies against PD-1, Tim-3, CD45RO, CD69, and CD127, and the PD-1+ Tim-3+ and PD-1- Tim3- phenotypes were compared (n = 11). Horizontal bars denote means. *P<0.05; ** P<0.01; *** P<0.001, compared with the PD-1+ Tim-3+ group.

