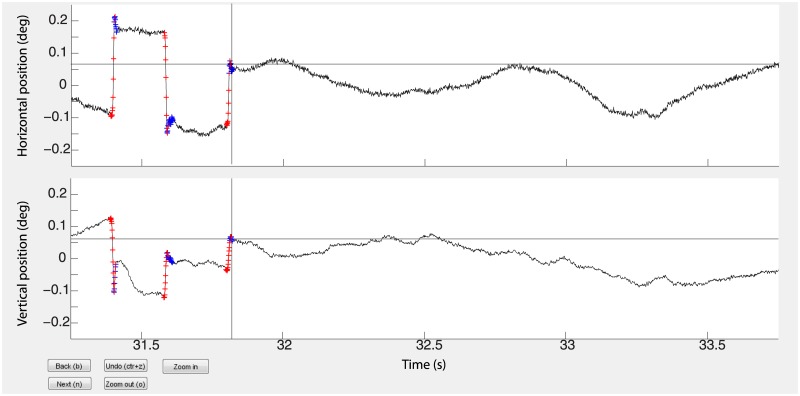
Fig 2. Microsaccade and overshoot detection.
Here we show the horizontal (top black trace) and vertical (bottom black trace) EyeLink data from subject 5 over a 2.5 second epoch of time. Microsaccades were manually detected by aligning (using the mouse as control) the cross hairs, shown simultaneously on the horizontal and vertical axes, with the start of the microsaccade and clicking the mouse, and then aligning to the stop of the microsaccade and clicking the mouse. Overshoots were detected in the same way. An overshoot always began at the sample after the end of the microsaccade. The red crosses on the black traces indicate the defining samples of microsaccades and the blue crosses indicate the defining samples of the overshoots.

