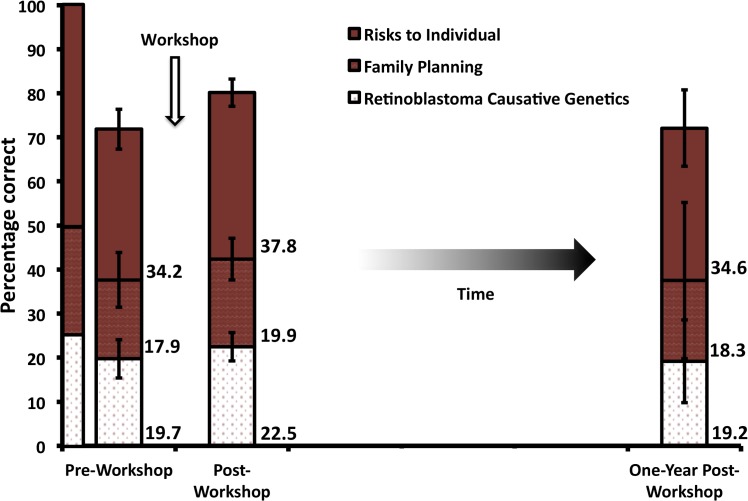
Fig 3. Mean test scores pre-, post- and one-year post-workshop.
Scores are patterned according to the question category. The leftmost column displays what a perfect test would look like, where “risks to individual” questions encompass 50% of the test, and “family planning” and “retinoblastoma causative genetics” are the subject of 25% of the questions each. The weighted score for each category is listed on the right of the column for pre-, post- and one-year post-workshop scores. Error bars indicate standard deviation per category.

