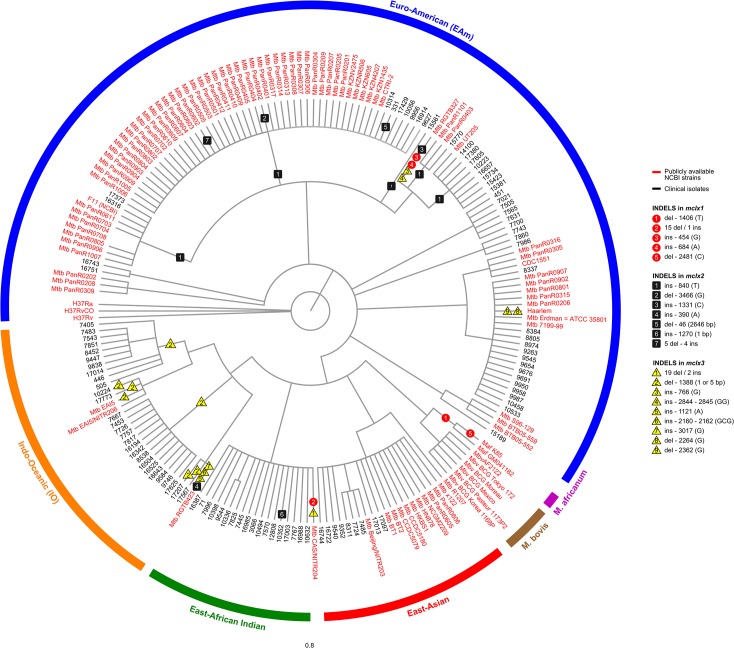
Fig 2. A parsimony-based phylogenetic tree depicting the distribution of pseudogenization events across the 3 mclx genes in both epidemiologically characterized clinical isolates (n = 100; denoted in black) and publicly available NCBI strains (n = 100; denoted in red).
LSP-defined MTBC lineages/sublineages are colour-coded and indicated in the outer arc (Purple – Mycobacterium africanum; Brown—Mycobacterium bovis; blue—Euro-American lineage; red—East-Asian lineage; orange—Indo-Oceanic; green—East-African Indian lineage).

