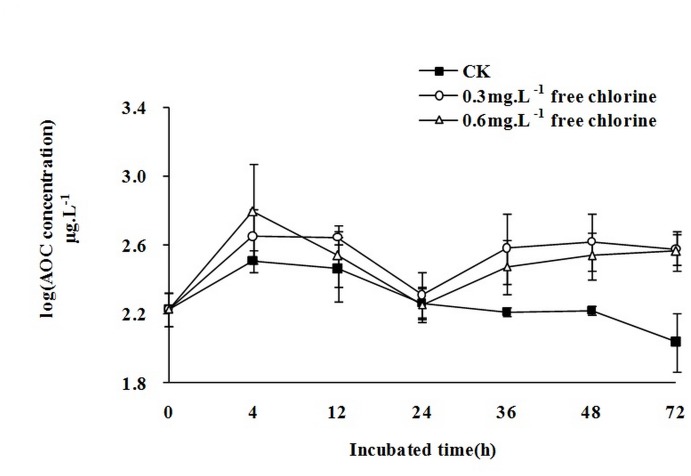
Fig 3. The variation tendency of AOC concentration in 72h.
All data points are average values for triplicate samples. Error bars indicate standard deviations. (CK means the initial free chlorine concentrations were 0 mg.L-1. The line with circles means the initial free chlorine concentrations were 0.3 mg.L-1 and the line with triangles means the initial free chlorine concentrations were 0.6 mg.L-1).

