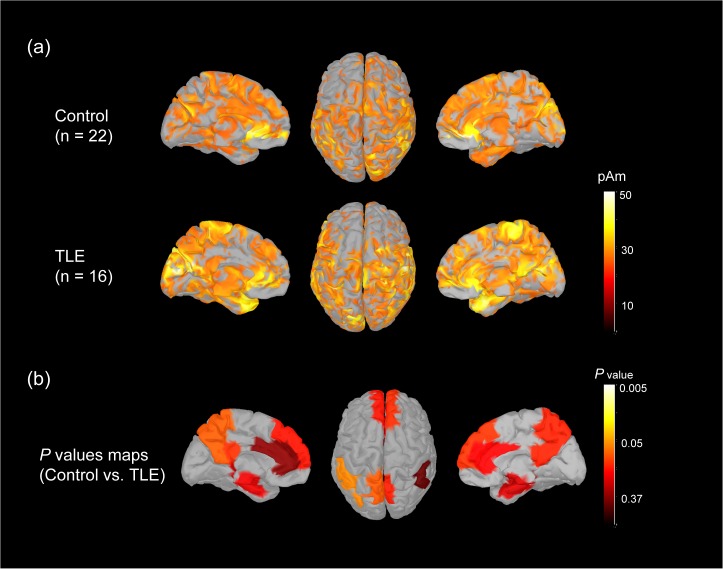
Fig 2. Cortical activation during resting state condition.
(a) The distribution of the average cortical activation during an eyes-closed resting-state condition in 22 control subjects and 16 TLE patients. The activation maps are shown from the top and medial views. The source values were smoothed after re-interpolation (the size of the smoothing kernel = 5). Only the cortical sources which strength is larger than 60% of maximal value are displayed. The current strength for cortical sources shown is color coded with large values represented in white. (b) The p-value maps from the activation comparisons between control subjects and TLE patients are shown. The maps are color coded with significance represented in white and light yellow.

