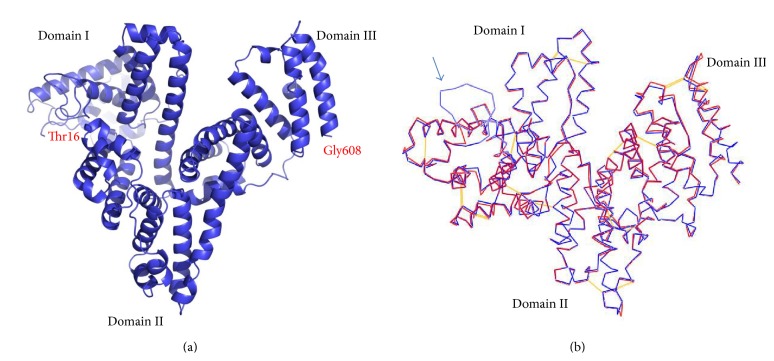
Figure 3.
(a) AFP structure model. It exhibits a V-shaped structure, the domain I in the left side of V-shape (the N-terminal), domain III in the right side of V-shape (C-terminal), and domain II in the bottom of V-shape (middle region). (b) AFP structure model (blue line) overlaps with HSA structure (red line). The AFP structure model was generally well fitting with the structure of HSA, a notable difference is in the sequence position 25–50 region, and the AFP was obviously looped out (indicated by arrow).

