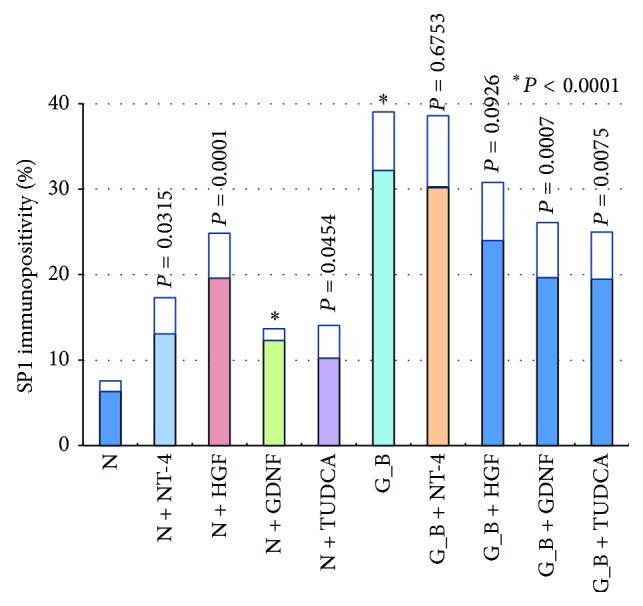
Figure 5.

Graph showing the ratio of SP1 immunopositive cells to all cells in the GCL of retinal explants. N, serum free media, G_B, glucose-AGE-BSA; Glycol, glycolaldehyde-AGE-BSA; Glycer, glyceraldehyde-AGE-BSA; NT-4, neurotrohin-4; HGF, hepatocyte growth factor, GDNF, glial cell line-derived neurotrophic factor; TUDCA, tauroursodeoxycholic acid.
