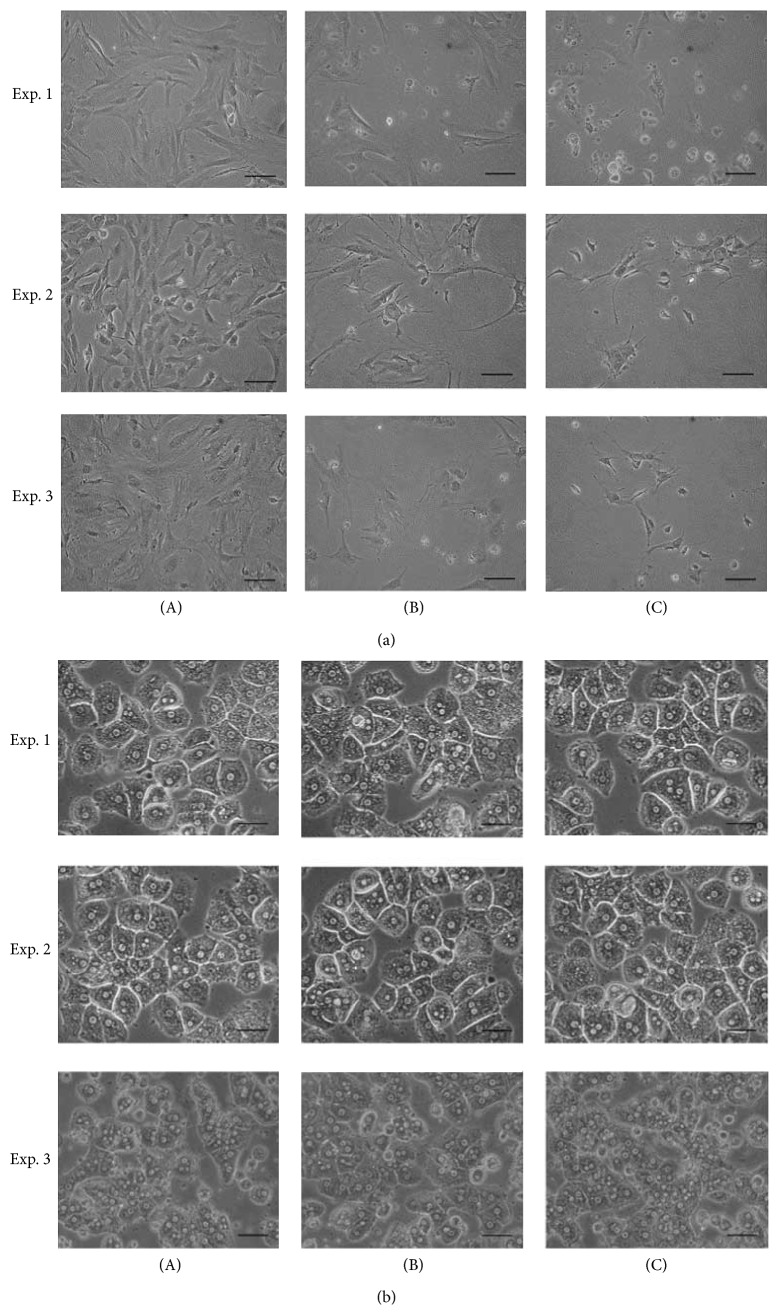
Figure 1.
Effects of SME on aHSC and HC morphology. aHSCs (a) and HCs (b) were cocultured with SME at 0 (A), 0.3 (B), and 0.5 (C) mg/mL for 72 h and were observed under a microscope. Three independent experiments (n = 3; i.e., using cell preparations from 3 rat livers) were carried out for any sets of experiments. The scale bar equals 50 μm.

