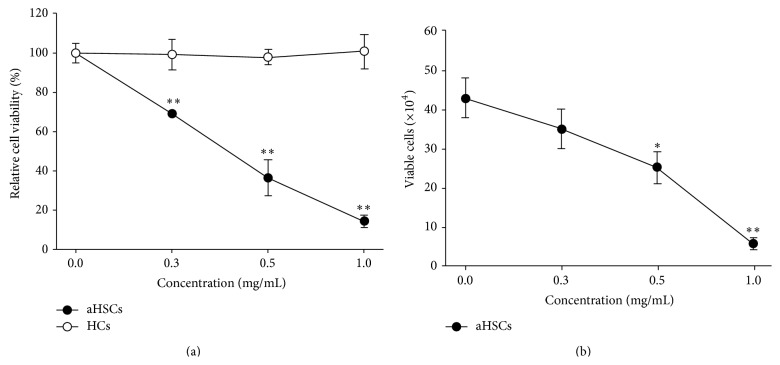
Figure 2.
Effects of SME on aHSC and HC viability. aHSCs (●) and HCs (○) were treated with SME (0, 0.3, 0.5, and 1.0 mg/mL) for 72 h. Cell viability was determined by an MTT assay (a); the number of viable aHSCs was determined by a Trypan blue exclusion assay (b). The results are presented as the means ± SD. ∗ p < 0.05, ∗∗ p < 0.01, compared with control (0 mg/mL SME).

