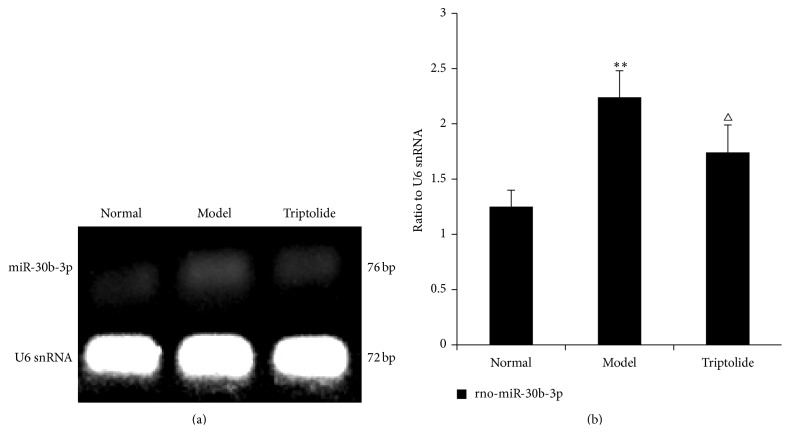
Figure 10.
Differential expression of rno-miR-30b-3p in each group. The level of rno-miR-30b-3p expression is expressed in relation to that of U6 snRNA. (a) The data show representative agarose gel electrophoretic patterns from one of three experiments. (b) Graphs illustrate rno-miR-30b-3p/U6 snRNA ratios. Data are expressed as the mean ± S.E.M. (Compared to the normal group: ∗∗ P < 0.01; compared to the model group, △ P < 0.05.)

