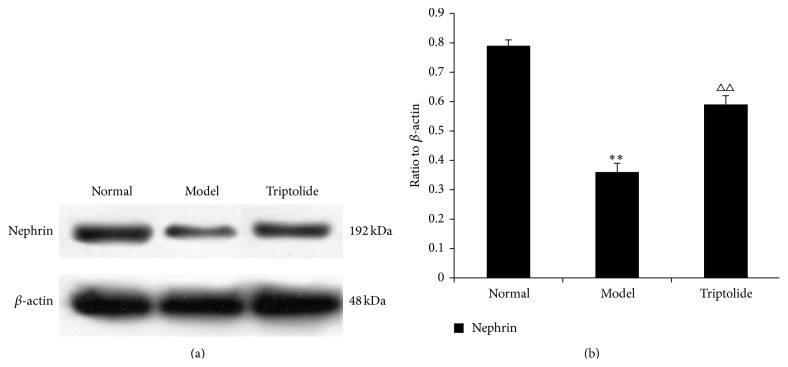
Figure 6.
Triptolide upregulated the expression of nephrin. The level of the nephrin protein is expressed in relation to that of β-actin. (a) The data show representative blots of nephrin and β-actin from three independent experiments. (b) Graphs illustrate nephrin/β-actin ratios. Data are expressed as the mean ± S.E.M. (Compared to the normal group: ∗∗ P < 0.01; compared to the model group: △△ P < 0.01.)

