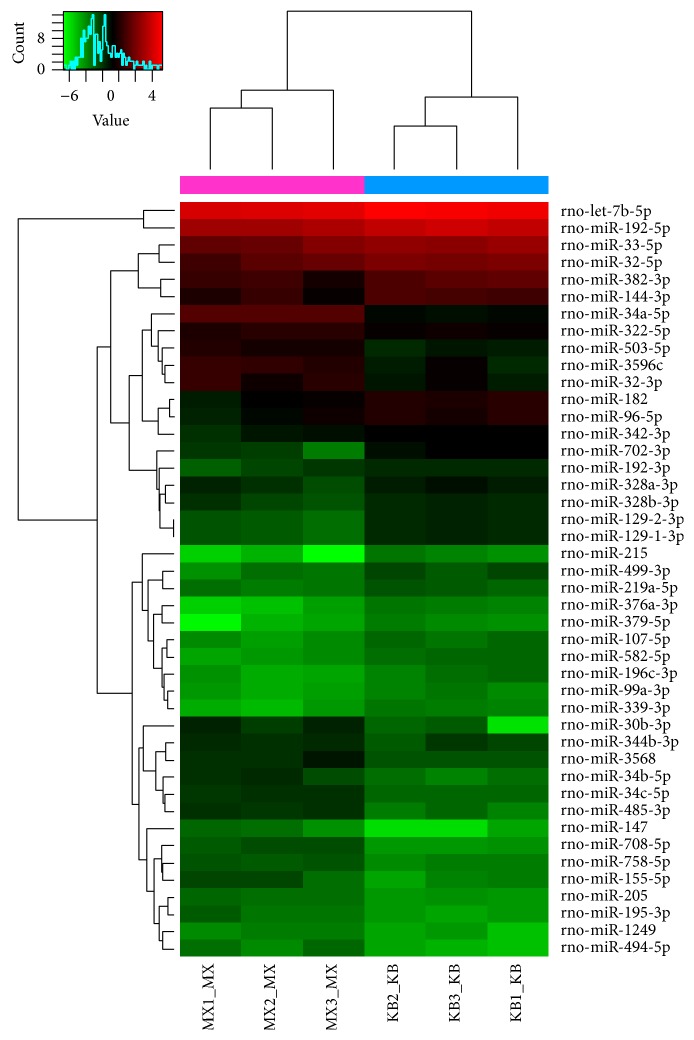
Figure 7.
Hierarchical clustering of the normal and model groups. Differential miRNA expression profiles were observed. Red indicates upregulated miRNAs (higher expression) and green indicates downregulated miRNAs (lower expression); the aggregation tree is above the sample and the miRNA aggregation tree is on the left. MX: the model group; KB: the normal group.

