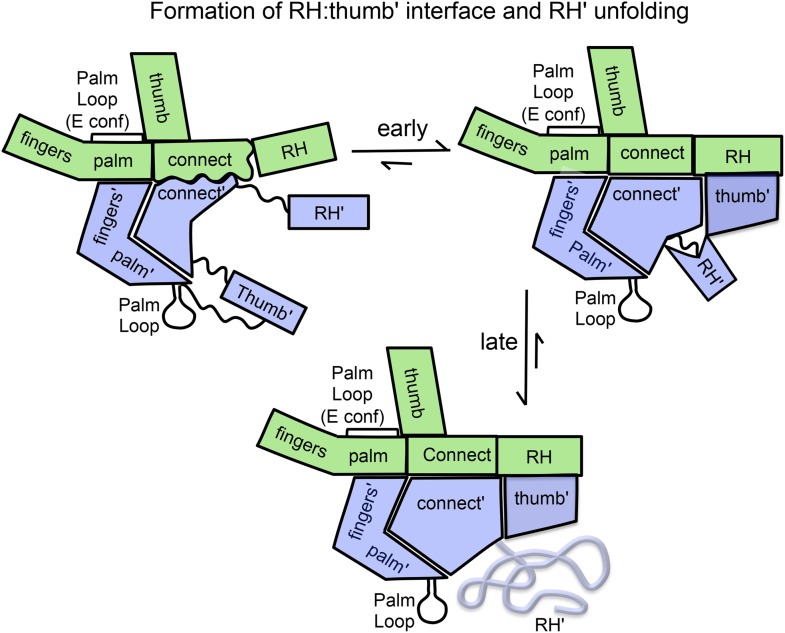
Figure 9. Schematic illustration of the maturation of the p66/p66' homodimer.
This figure illustrates the more rapid and the slower time-dependent changes occurring subsequent to initial isomerization/dimerization. The subunit conformations are color coded as in Figure 1.

