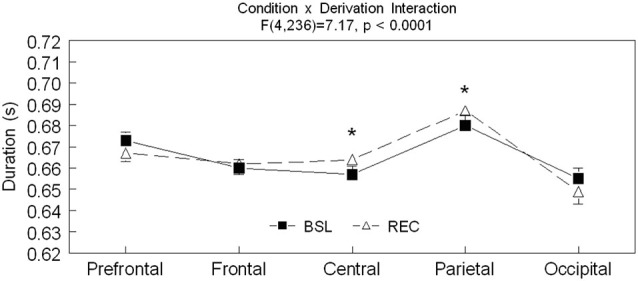
Figure 3.

Spindle duration is shown in all derivations for BSL (black squares) and REC (open triangle; mean ± standard error of mean). Simple effect analyses showed significant interactions between sleep condition and derivations (Prefrontal: F(1,59) = 3.9, p = 0.54; Frontal: F(1,59) = 0.41, p = 0.53; Central: F(1,59) = 6.65, p = 0.01; Parietal: F(1,59) = 4.46, p = 0.04; and Occipital: F(1,59) = 2.66, p = 0.11). Stars indicate significant differences between BSL and REC in both age groups (ES: *: [0.7–0.10]).
