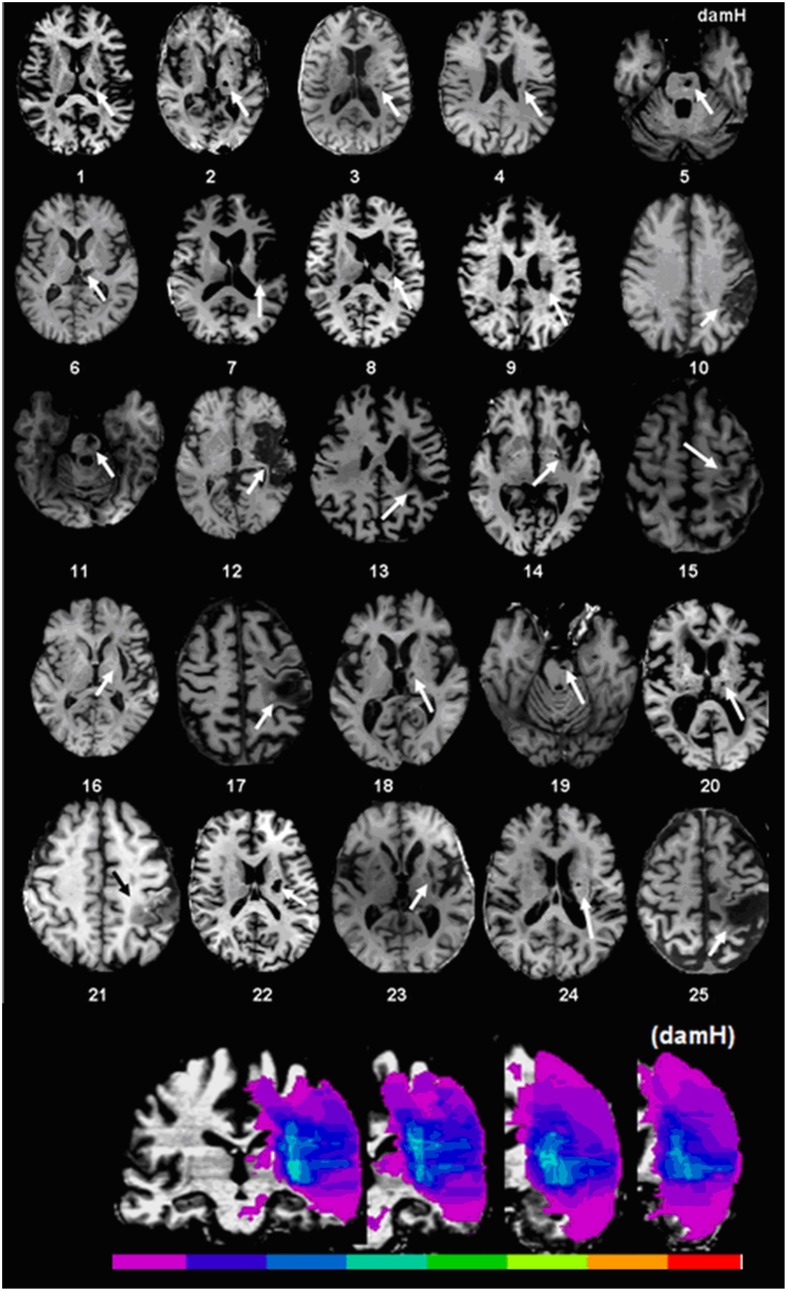
Figure 1.
Stroke localization and overlap. Upper panel: T1 magnetic resonance imaging (MRI) at the level of the main stroke injury. Lower panel: Lesion overlap in stroke patients symbolized by the color scale. Purple represents the stroke area of a single patient, green represents localization shared by half of the patients, and red indicates localization shared by all of the patients. For patients with lesions on the right side of the brain, the 3D-T1 MRI was flipped. The map of lesion localization and overlap was created with MRIcro 1.4. DamH: damaged hemisphere.

