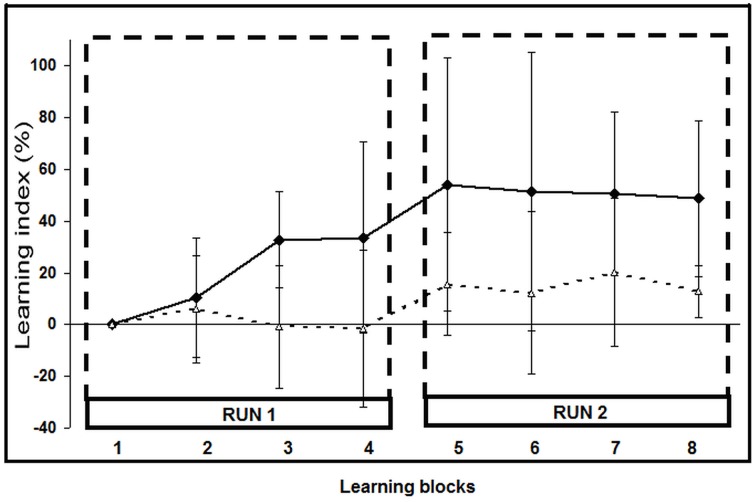
Figure 3.
Learning Index (LI) evolution across learning blocks. The eight LI values (mean ± SD) correspond to the LI during each learning block. Black squares: shifter stroke subgroup (n = 9; LI, 49 ± 30% at the last block); white triangles: fitters stroke subgroup (n = 14; LI: 13 ± 10%; p = 0.0005).

