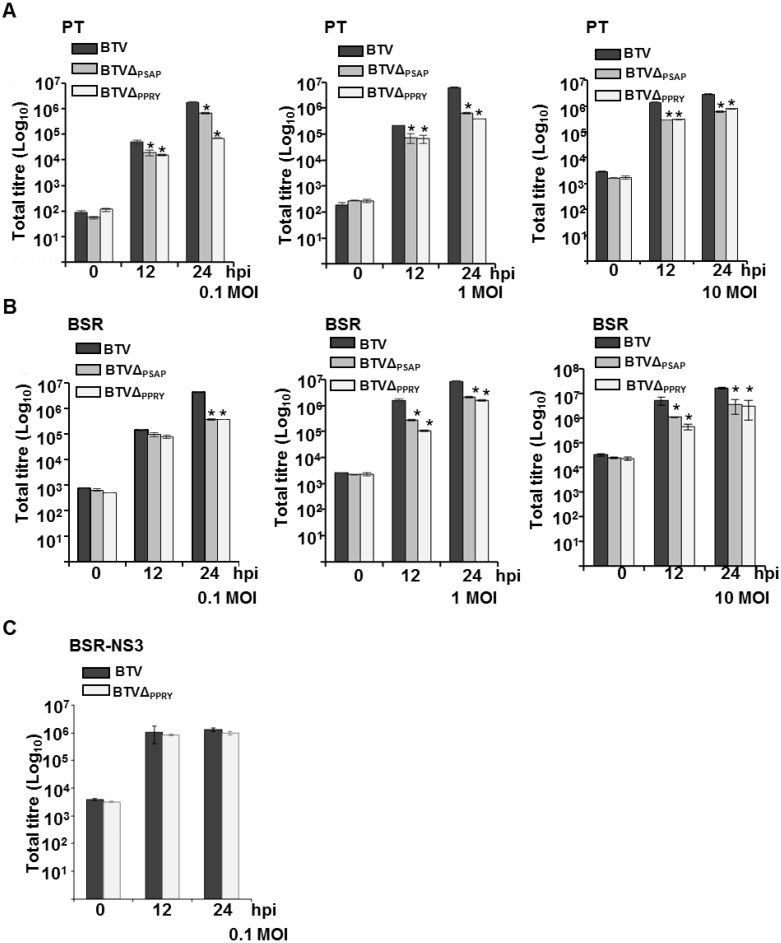
Figure 6.
Characterization of BTVΔPPRY and BTVΔPTAP. Total titres at different times pi of either BTVΔPPRY, BTVΔPSAP or BTV in PT (A); BSR (B) and BSR-NS3 (C) cells were determined, expressed as PFU/mL, and plotted on logarithmic scales. Asterisk (*) indicates that the decrease in titres of BTVΔPPRY or BTVΔPSAP at 12 and 24 h pi is statistically significant to BTV (p < 0.05). The MOI of infection, cell types and viruses used have been indicated in each graph.

