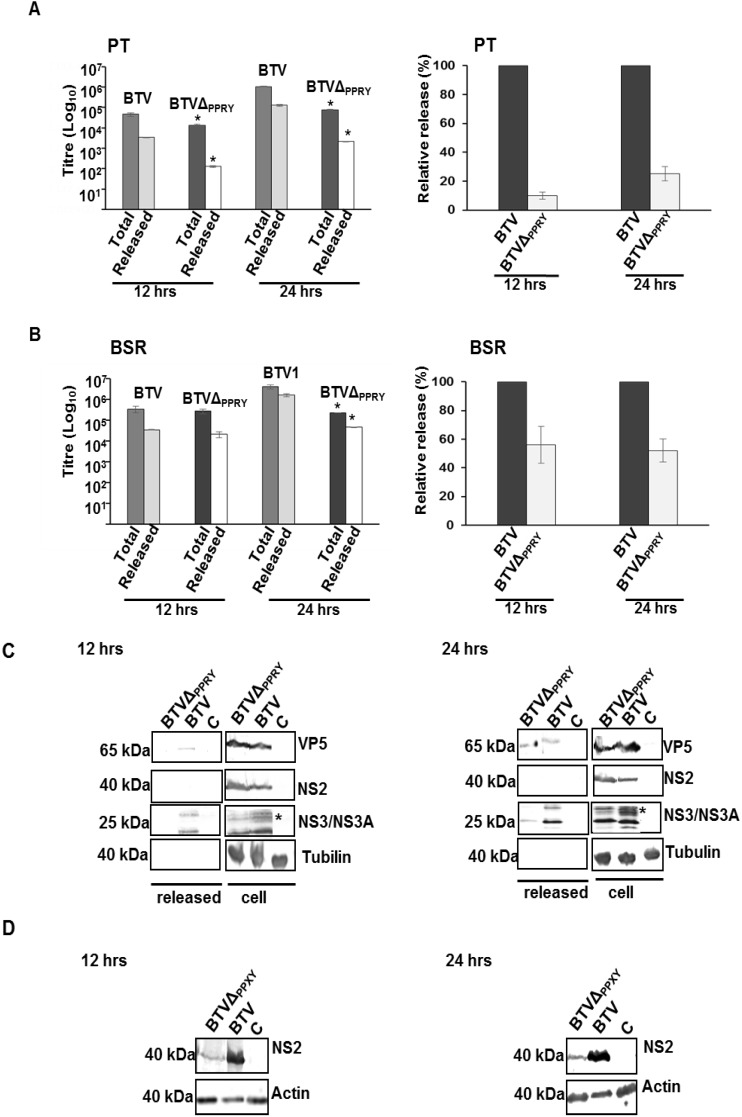
Figure 8.
Release of BTV influenced by mutation of PPRY domain. The total and cell free titres in PT (A, left) and BSRs (B, left) were plotted on a logarithmic scale. The titre of each fraction was determined by plaque assay. (A,B, right) The relative release was calculated as the ratio of cell free to total virus titre and normalized to 100% for control virus release. Bars represent the standard errors from three sets of replicates; (C) Release of virus particles from PT cells infected with BTVΔPPRY or BTV. Monolayers of PT cells were infected with mutant or control virus. The supernatant and whole cell lysates were harvested 12 h pi (left) and 24 h pi (right) and analyzed by immunoblotting with antibodies against VP5, NS2, NS3/NS3A and tubulin. The protein bands belong to different regions of the same blot. The glycosylation pattern is indicated by asterisk; (D) Analysis of NS2 and actin in BSR cells infected with supernatants of PT cells infected with mutant and control viruses, harvested at 12 and 24 h pi.

