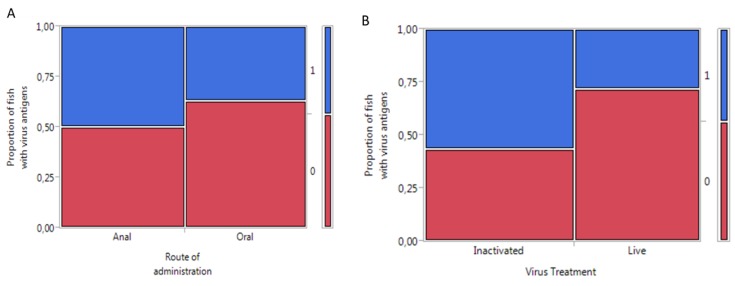
Figure 2.
Mosaic plot showing the response of Atlantic salmon to administration of infectious pancreatic necrosis virus: (A) comparison between routes of administration and (B) comparison between virus treatments. Key: 0 = no antigens detected; 1 = antigen detected in the fish; oral: n = 27; anal: n = 28; live virus: n = 25; inactivated virus: n =30.

