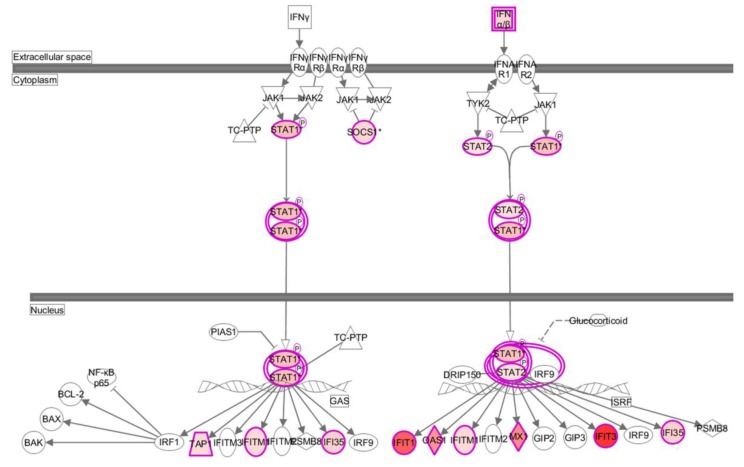
Figure 7.
IFN pathway in response to virus infection at 24 hpi. DE genes were submitted to IPA, and IFN pathway in response to virus infection at 24 hpi was constructed. The size and color of nodes reflect the degree of expression difference between control and H5N1 infection. Nodes in red color indicate upregulated genes; Nodes in white color indicate insignificantly changed genes.

