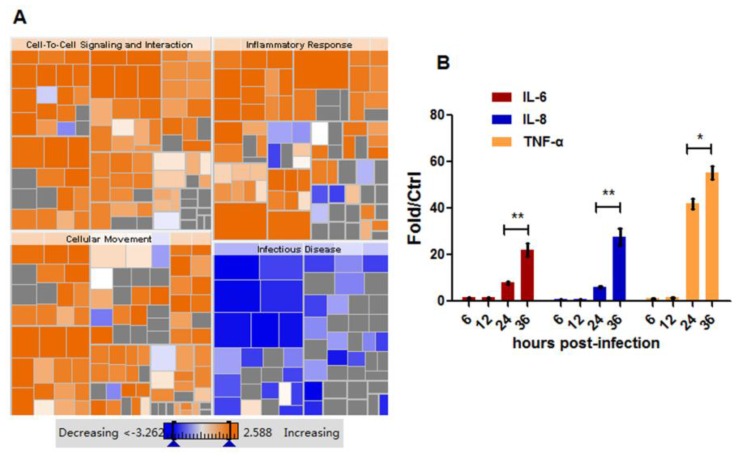
Figure 8.
Inflammatory response further strengthened as viral infection deepened. (A) Differentially expressed genes at 24 hpi were submitted to IPA and the Downstream Effects Analysis was performed using IPA. Red colors indicate predicted increased biological processes; (B) IL-6, IL-8, and TNF-α expression were tested by RT-PCR in response to viral infection. GAPDH was used for normalization. Data was mean ± SEM. Statistical significance was analyzed by student’s t-test. * p < 0.05, ** p < 0.01.

