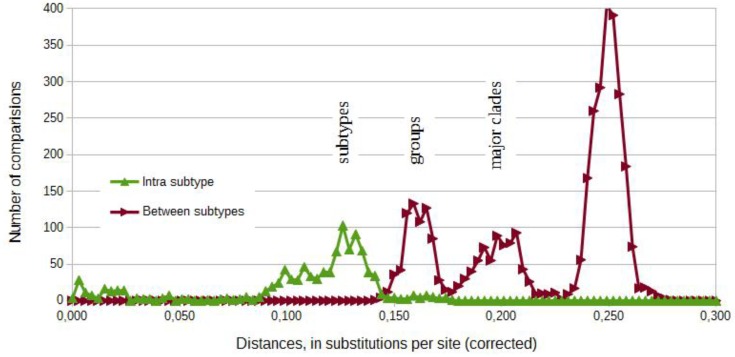
Figure 2.
Frequency diagram of corrected distances between sequences from Figure 3a. It shows a possible separation of subtypes and suggests a possible definition of groups (3chi, 3jab and 3feg) and of major clades 3-I and 3-II (Norder, 2009). Pairwise distances were estimated using the Maximum Composite Likelihood (MCL) approach and grouped in intervals of 0.003. A discrete Gamma distribution was used to model evolutionary rate differences among sites (five categories). All positions with less than 95% site coverage were eliminated.

