
Figure 4.
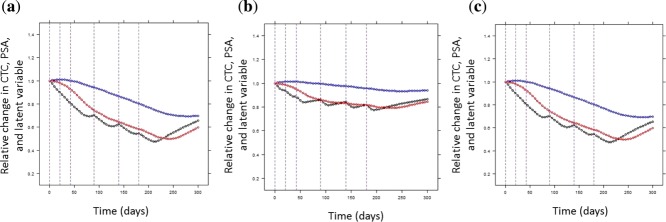
Simulations under different treatment regimens. The circulating tumor cell (CTC), prostate-specific antigen (PSA), and the latent variables, all normalized by their baseline values, were plotted vs. time. Different typical patients were represented: (a) receiving chemotherapy alone, (b) hormonotherapy alone, or (c) both simultaneously. Blue curves represent the PSA kinetics, red curves the CTC kinetics, and black curves the latent variable kinetics. Vertical lines represent the treatment cycles.