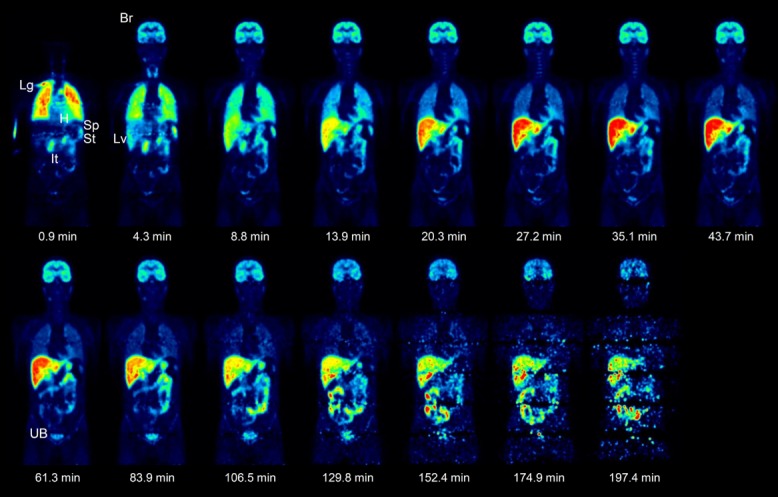
Figure 1.

Time-course of 11C-CLZ distribution in the whole-body, represented by PET images of a subject at various timepoints. Images were normalized to the injected 11C-CLZ dose and subject body weight. Lg, lung; H, heart; Sp, spleen; St, stomach; It, intestine; Br, brain; Lv, liver; UB, urinary bladder.
