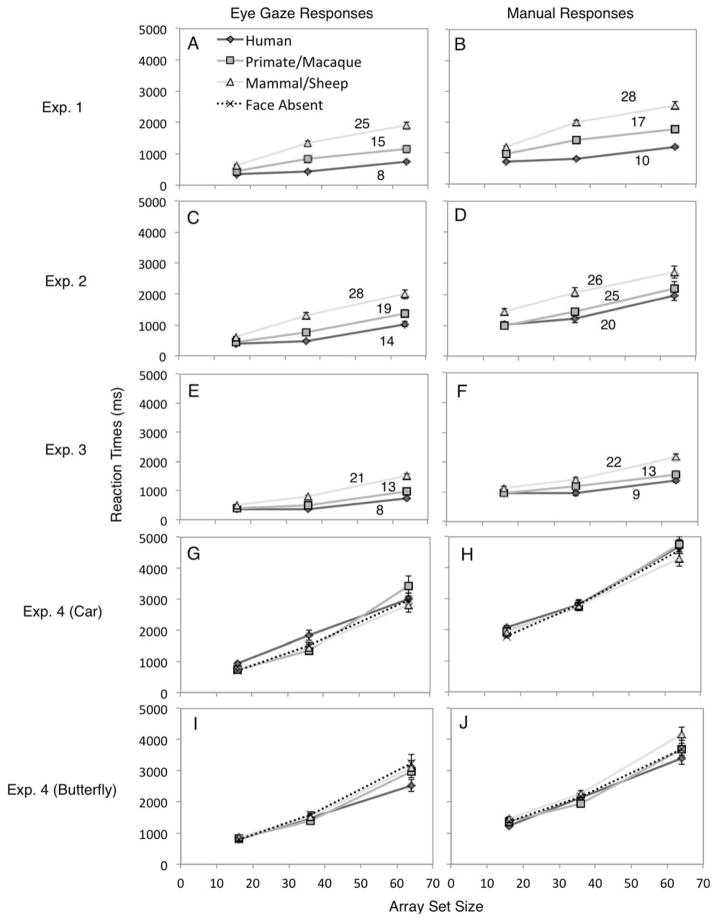
Figure 2.
Results showing the interaction between array size and target type in Experiment 1 (top row: A, B), Experiment 2 (second row: C, D), Experiment 3 (third row: E, F), and Experiment 4 (bottom two rows: G, H, I, J), for eye gaze RTs (left column) and manual RTs (right column). The darkest solid gray lines with the diamond points represent the human faces, the medium gray lines with the square points represent the primate/macaque monkey faces, the light gray lines with the triangle points represent the mammalian/sheep faces, and the dotted lines with x points represent face absent trials (i.e., no distractor; Experiment 4 only). Numbers reflect the search slopes (ms/item); these are not reported for Experiment 4 because there were no significant differences across face distractor types, ps > .10. Error bars represent within-subjects standard error of the mean. All statistical comparison results were the same for both gaze and manual response measures.

