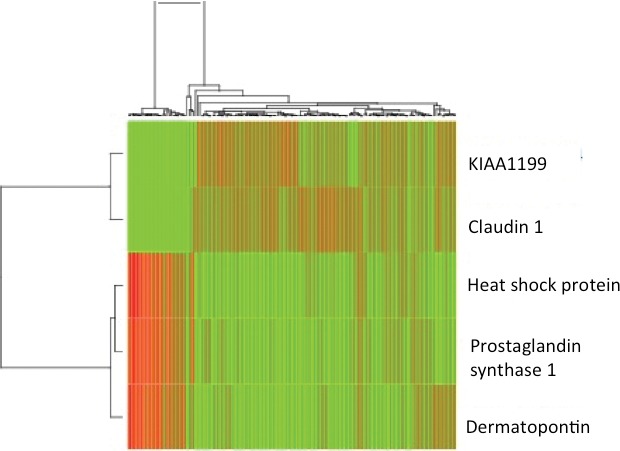
Fig. 3.

Heat map representing clustering according to sample association and gene expression combined (normal versus rectal cancer stages I–III combined). Genes displayed in the heat map are as follows: KIAA1199, claudin 1, Heat shock protein alpha-crystallin-related B6, and dermatopontin.
