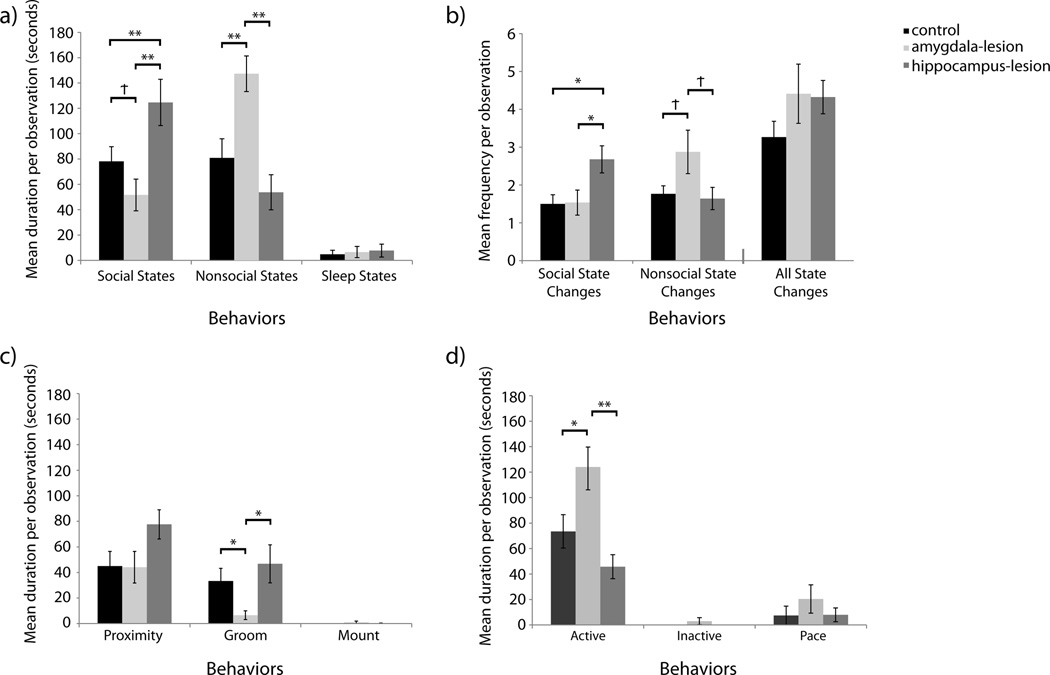
Figure 1. Initiation of Social States.
[a] Duration of time spent in nonsocial states and states initiated with pair-mates. Raw means are presented in the figure although analyses for Sleep States were performed on log transformed data to account for non-normality data distributions. [b] Frequency of state changes. Raw means are presented in the figure although analyses for Nonsocial State Changes were performed on log transformed data to account for non-normality. [c] Duration of time spent in close social interactions initiated with pair-mates. Raw means are presented in the figure although analyses for Groom and Mount were performed on log transformed data to account for non-normality. [d] Duration of time spent alone. Raw means are presented in the figure although analyses for Active, Inactive, and Pace were performed on log transformed data to account for non-normality. Significant differences between lesion conditions as per independent sample t-tests are indicated using the following symbol key: Ϯ = p< .10, * = p< .05, ** = p< .01.

