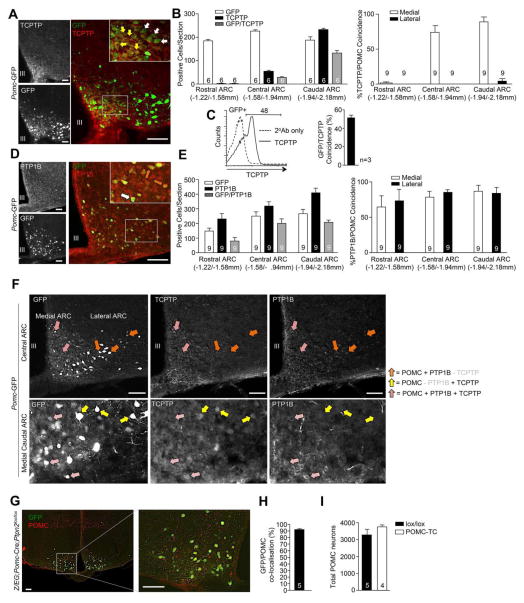
Figure 1. TCPTP and PTP1B in POMC neurons.
a) Immunostaining for TCPTP in GFP+ ARC POMC neurons. b) Rostral-caudal immunostaining quantification of GFP and TCPTP expressing ARC cells. c) Papain-digested hypothalami of Pomc-GFP mice were analysed by flow cytometry for GFP and TCPTP. d) Immunostaining for PTP1B in GFP+ POMC neurons. e) Rostral-caudal immunostaining quantification of GFP and PTP1B expression in the ARC. f) Immunostaining for PTP1B and TCPTP in GFP positive POMC neurons in the ARC. g) Immunostaining and h, i) quantification of ARC GFP and POMC co-localisation and the total number of ARC POMC neurons in POMC-TC;Z/EG mice. Representative images of 3 or more experiments are shown. Data are means ± SEM for the indicated number of mice (30 sections/mouse), or (c) experimental repeats.

