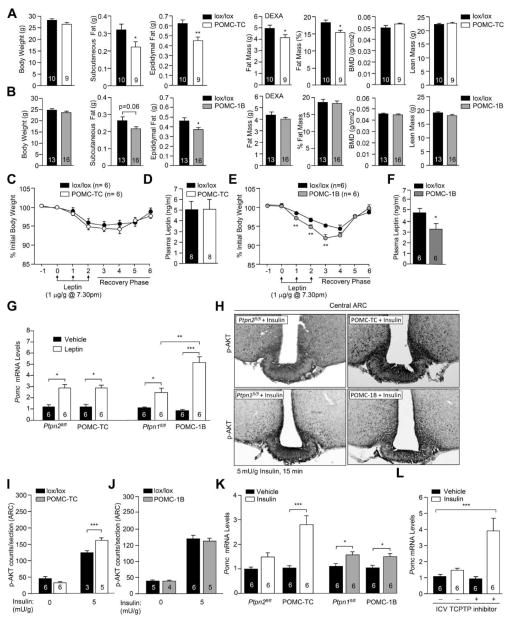
Figure 2. TCPTP and PTP1B regulate insulin and leptin signaling.
a–b) Body and WAT weights and body composition in 10 week-old POMC-TC, POMC-1B and lox/lox mice. (c & e) POMC-TC, POMC-1B and lox/lox mice were administered leptin and body weights monitored. d & f) Fed plasma leptin levels. g) Hypothalamic Pomc gene expression in mice injected IP saline or leptin (1 μg/g, 2 h). h–j) p-AKT immunostaining in mice administered saline or insulin. k) Hypothalamic Pomc gene expression in mice injected IP saline or insulin (0.85 mU/g, 2 h). l) Hypothalamic Pomc gene expression in C57BL/6 mice administered saline or insulin (0.85 mU/g, IP, 2 h) followed by aCSF or TCPTP inhibitor [1.5 μl 0.2 nmol compound 8, ICV]. Results are means ± SEM and are representative of 3 independent experiments; significance determined using c, e, g–l) two-way, or m) one-way ANOVA.

